· SciArt & Data Analysis · 3 min read
Python Galaxy Visualisation
An interactive 3D visualization of the solar system using Python and Plotly.
Overview
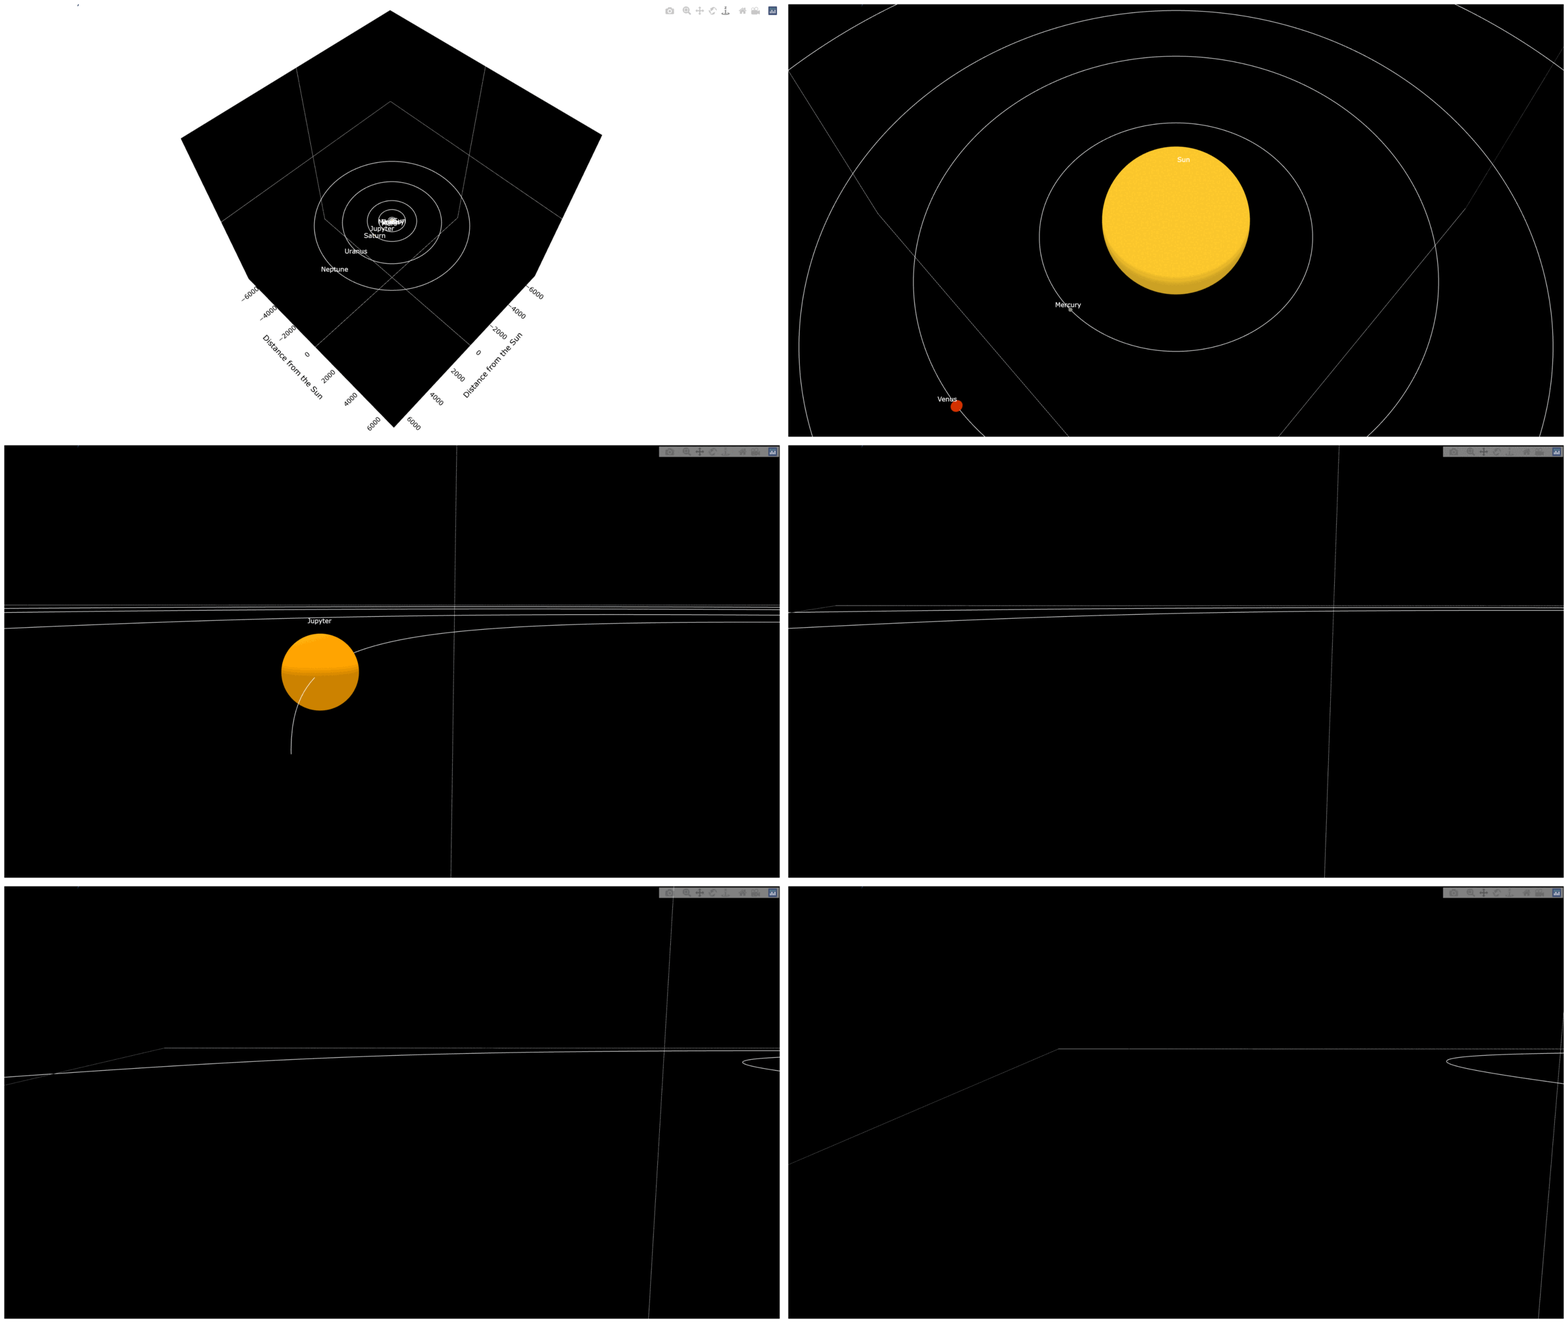
In this project, I developed an interactive 3D visualization of the solar system using Python and Plotly. The model includes the sun, eight planets, their orbits, and Saturn’s rings, allowing users to explore the positions and movements of celestial bodies within our solar system.
Role
This was a solo project for a module I undertook at the University of Leicester called “SciArt & Big Data Analysis”.
Tools and Technologies
- Plotly: For creating interactive 3D visualisations.
- NumPy: For mathematical computations and generating coordinates.
- Python: The primary programming language used for scripting and data handling.
Project Highlights
Visualisation
The model features a 3D representation of the solar system with different colours for each planet. It includes interactive elements that allow users to rotate and zoom in on the model to view it from different angles.
Challenges and Solutions
- Technical Challenges: One of the main challenges was accurately plotting the orbits and ensuring that the model was accurate, interactive and responsive. I sourced the information about the planets from data provided by NASA, and plotted this by making use of PlotLy’s powerful graphing libraries.
- Project Management: As a solo project, I managed myself by using a structured approach to break down the project into manageable tasks from coding to creating the video explanation (see end of post).
Code Snippet
Here’s a code snippet illustrating how I defined the orbits and positions of the planets:
import plotly.graph_objects as go
import numpy as np
import math

def spheres(size, clr, dist=0):
    theta = np.linspace(0,2*np.pi, 100)
    phi = np.linspace(0, np.pi, 100)
    x0 = dist + size*np.outer(np.cos(theta), np.sin(phi))
    y0 = size*np.outer(np.sin(theta), np.sin(phi))
    z0 = size*np.outer(np.ones(100), np.cos(phi))
    trace = go.Surface(x=x0, y=y0, z=z0, colorscale=[[0,clr], [1,clr]])
    trace.update(showscale = False)
    return trace

def orbits(dist, offset=0, clr='white', wdth=2):
    x_crd = []
    y_crd = []
    z_crd = []
    for i in range(0, 361):
        x_crd = x_crd + [(round(np.cos(math.radians(i)), 5))*dist + offset]
        y_crd = y_crd + [(round(np.sin(math.radians(i)), 5))*dist]
        z_crd = z_crd + [0]
    trace = go.Scatter3d(x=x_crd, y=y_crd, z=z_crd, marker=dict(size=0.1), line=dict(color=clr, width=wdth))
    return trace
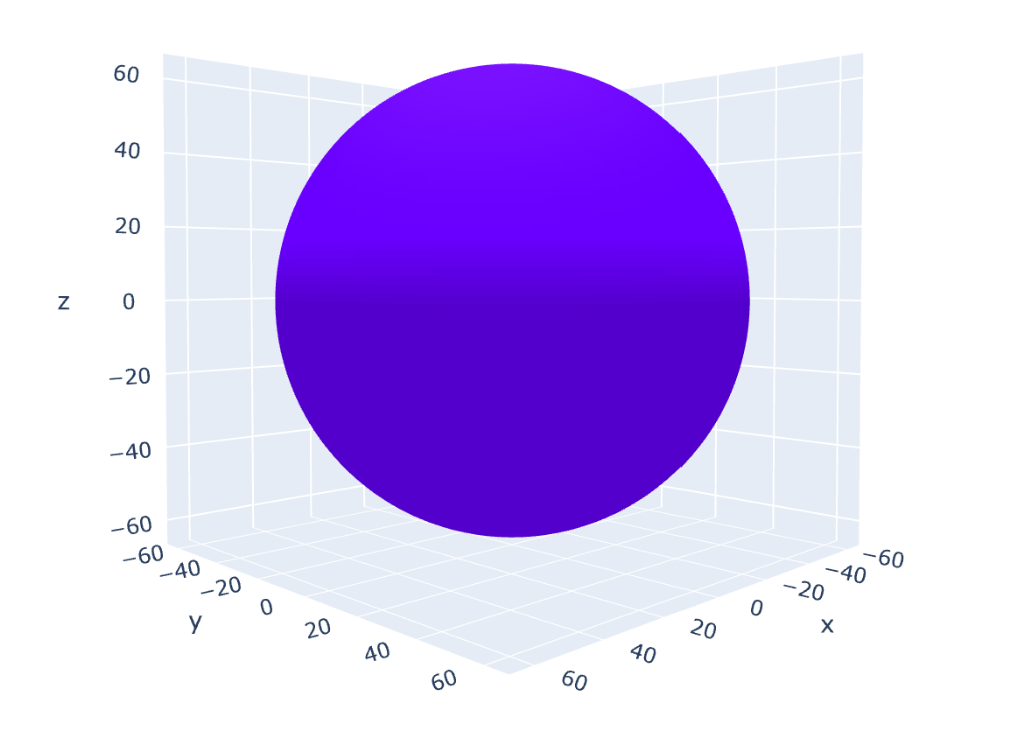
In this snippet, I used numpy to generate theta values representing angles in radians. The orbits dictionary contains the average orbital distances of the planets from the sun. For each planet, I calculated the x and y coordinates of its orbit using cosine and sine functions. These coordinates were then used to create 3D scatter plots for each orbit. The sun is added as a central point with a distinct yellow marker.
Test Models
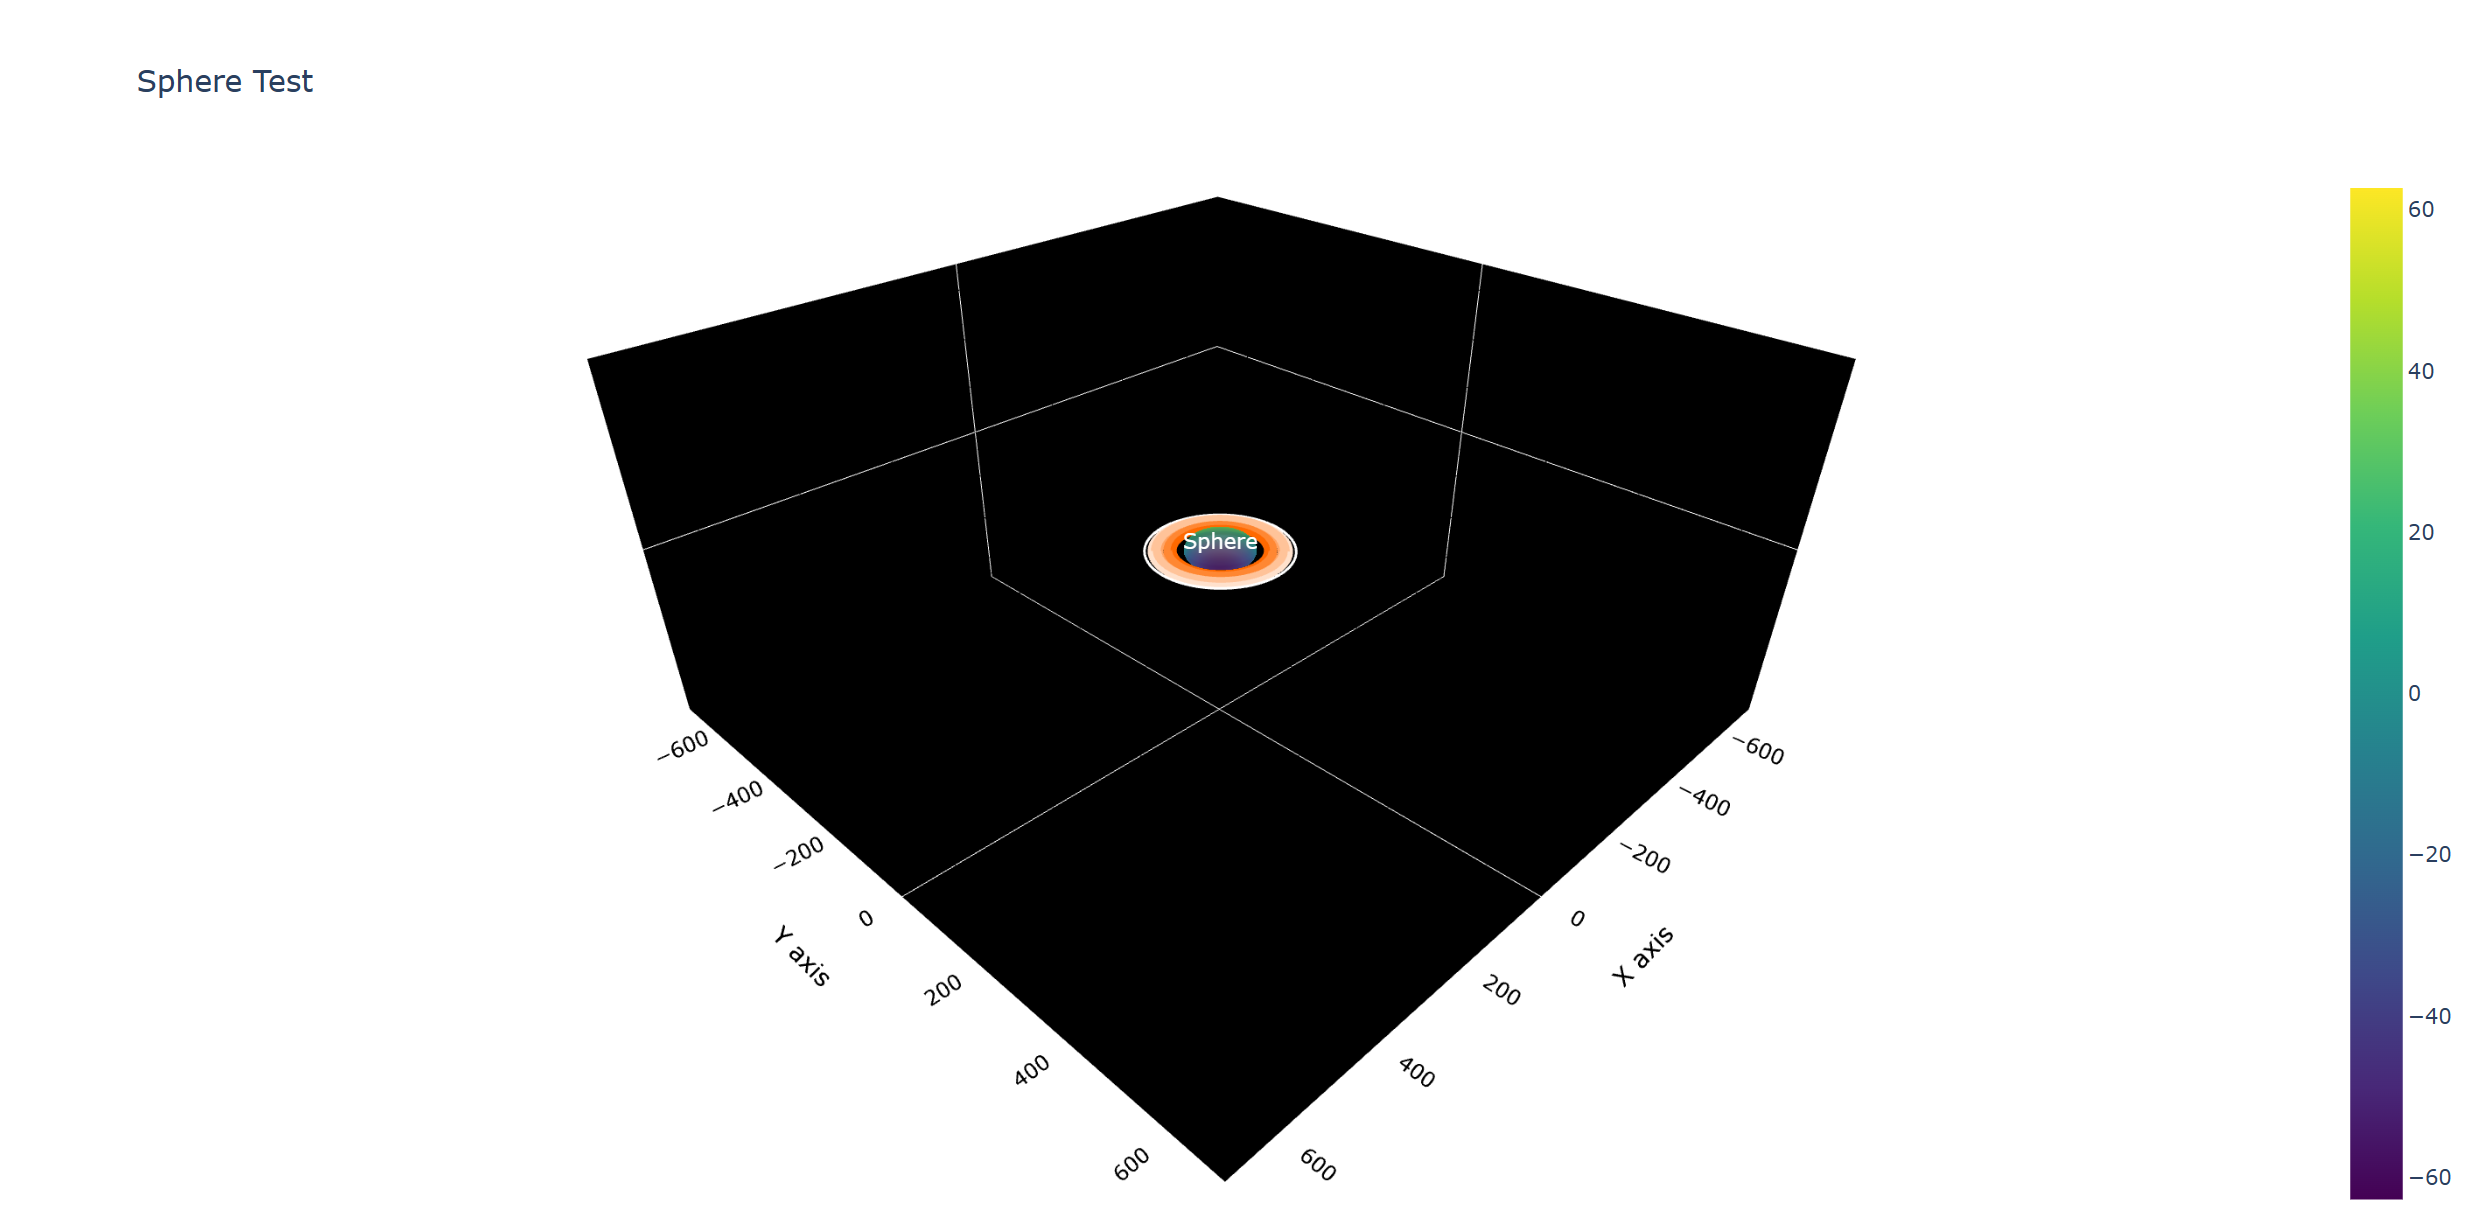
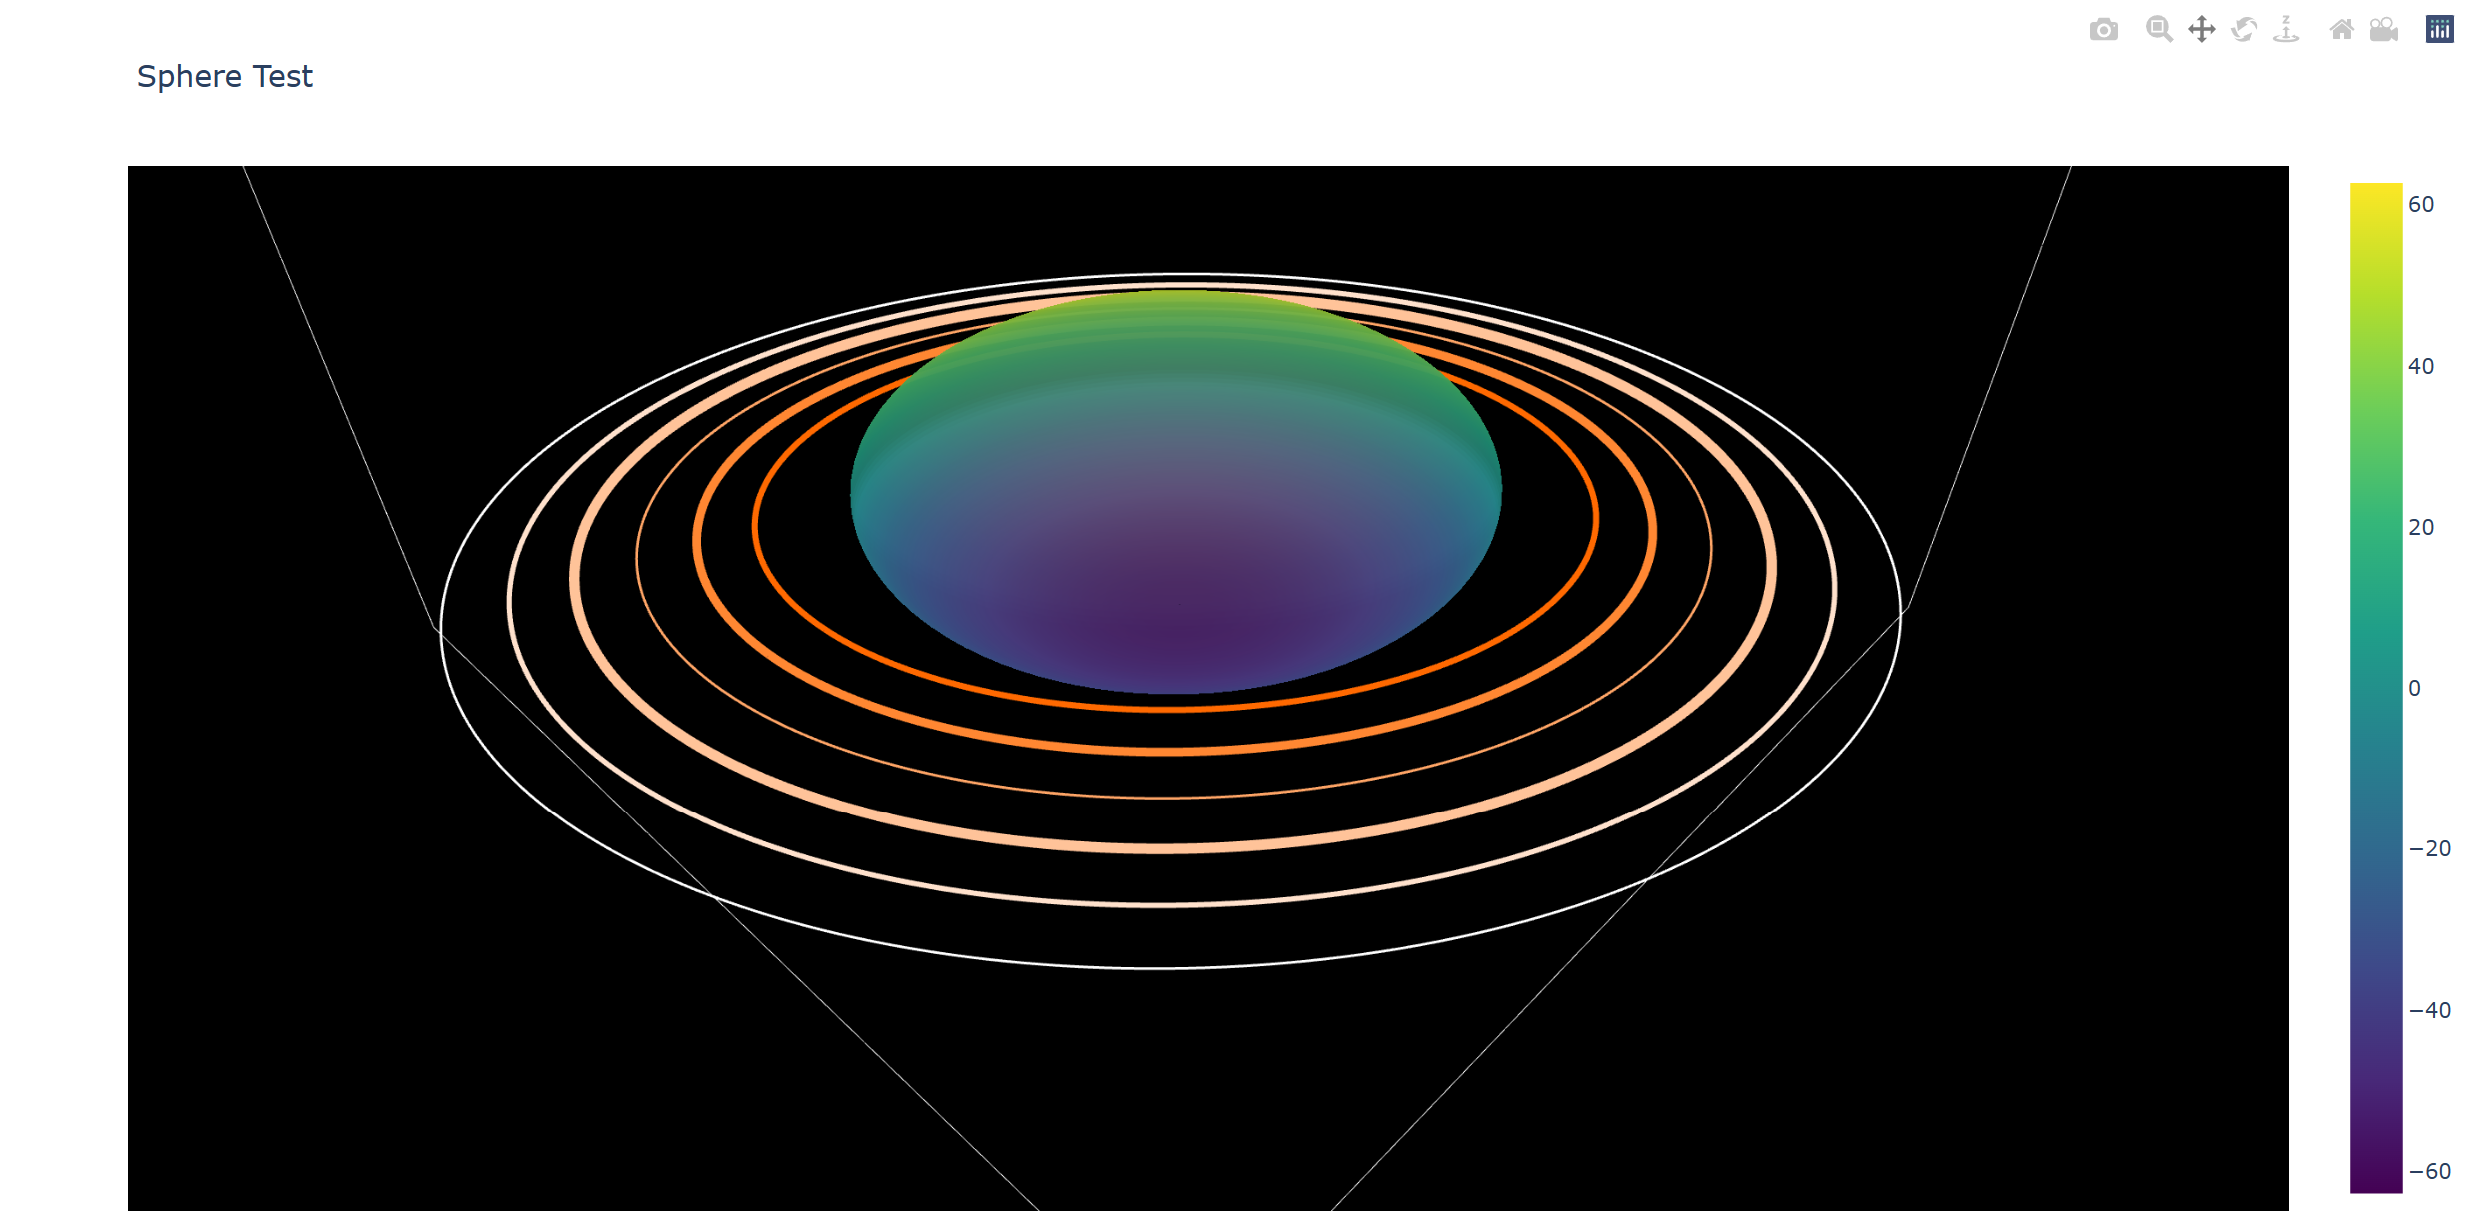
Full Code
The complete code for the project can be found on my GitHub here.
Video
Below is a video demonstration assisted by PowerPoint of the project which I created for my project submission.

